The Cubelets App has two main functions: Remote Control and Personality Swap. We’ve already introduced you to the Personality Swaps, but have you begun to use Remote Control in your classroom? There’s a hidden feature I want to highlight for you because it’s not the first application people think of when they see a title like Remote Control: gathering data about our robot constructions.
(Before you continue, it’s a good idea to make sure you understand how data travels through Cubelets by either reading this blog post or taking the Cubelets 102 (free) online workshop.)
As you already know, you can easily gather information about how data is traveling through a Cubelets robot construction using the Bar Graph Cubelet. The Bar Graph is also a screen-free way to gather data about your Cubelets constructions. It simplifies the numbers into a 1-10 scale, as opposed to numbers between 1-255, so it makes data flow conversations available for students who are still emergent mathematicians.
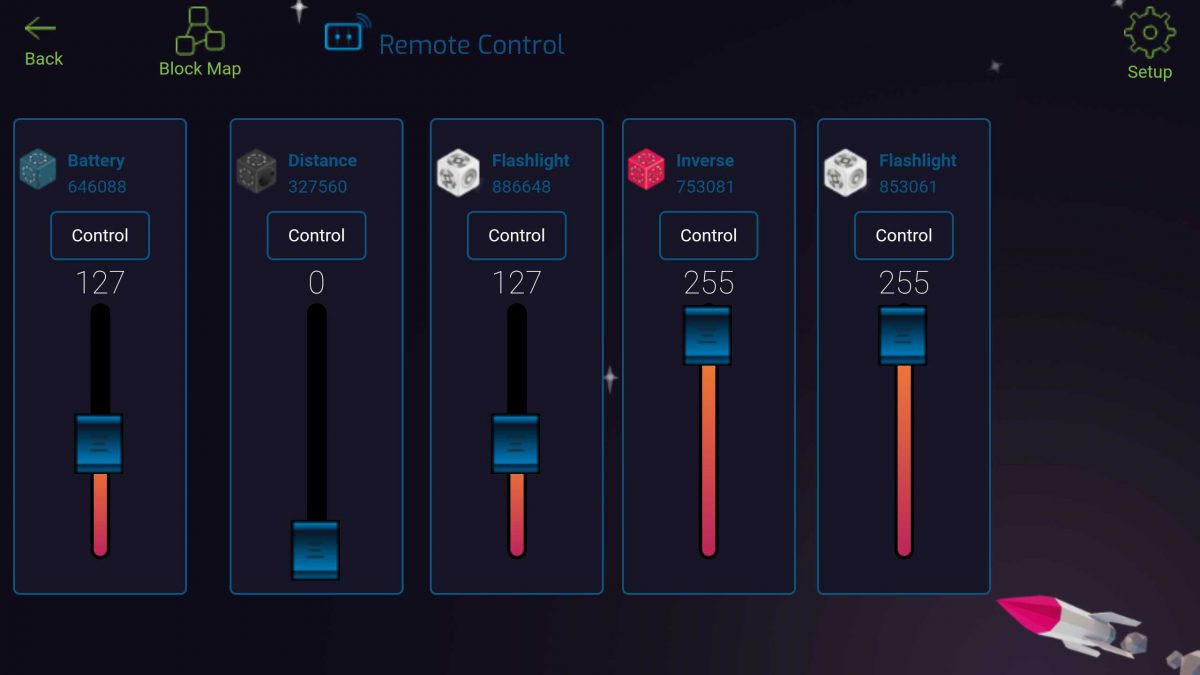
However, there is one thing Remote Control can do that Bar Graph Cubelets cannot: collect information about every Cubelet in a robot construction at the same time. By screenshotting the data in Remote Control, students can very quickly gather static data to analyze later.
As students build more complex creations, especially by adding multiple SENSE Cubelets, it’s more important that they check their assumptions about how the data is flowing through their robot constructions. In general, the five main states of a two-SENSE robot are:
- two sensors at 255,
- two sensors at 0,
- two sensors at ~127 (about halfway),
- one sensor at 255 while the other sensor is at 0,
- and vice versa.
This saves an incredible amount of time during the actual investigation and frees up time for meaningful data analysis as students compare the data to their predictions and try to explain the discrepancies.
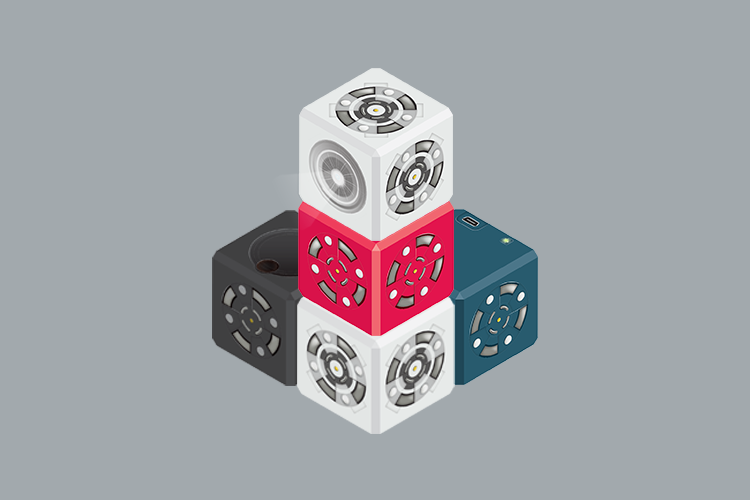
Here’s a great example. When students are learning about Data Flow Diagrams, show them this robot (leave the Battery off for an extra challenge!):
Often, students will create a Data Flow Diagram that looks something like this:
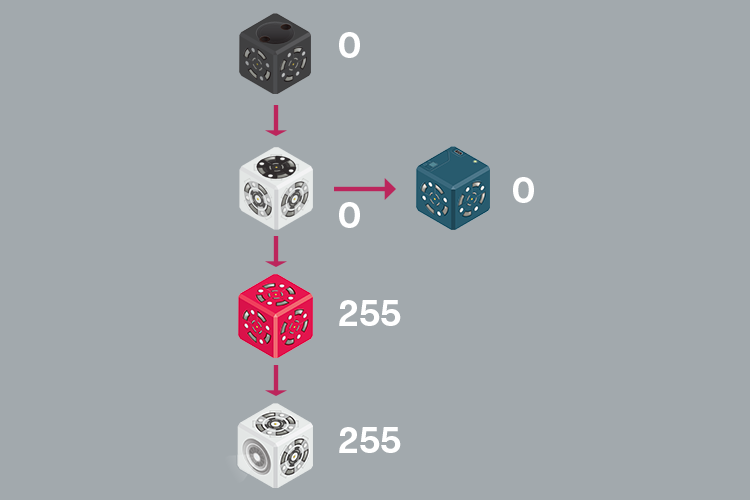
But look what the Remote Control tells us about our robot!
This tells us that we need to revise our data flow diagram from above. Here’s what our corrected Data Flow Diagram could look like:
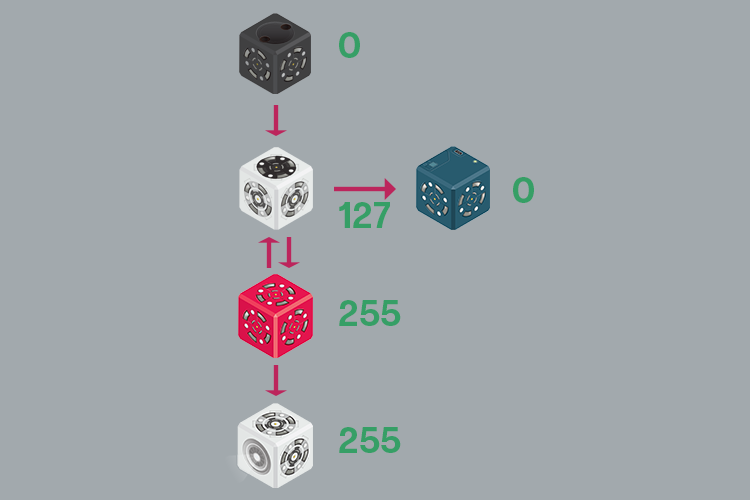
Because we were able to revise our model so quickly by screenshotting our data and saving it for later, we can now spend the rest of class investigating why our prediction was different than the actual Remote Control data. After several investigations, we might realize the answer is simpler than we thought. Remember: Cubelets pass data in all directions and they pass that information super quickly. This means the Inverse Cubelet (which received the value of 0 and turned it into a value of 255) is also sending that 255 back to the Rotate Cubelet. How cool is that?
To learn how to use Remote Control to gather data about a Cubelets construction, check out Create with Cubelets Episode 03.
Enjoyed this blog post? Sign up for the #CubeletsChat newsletter to receive the next blog post straight to your inbox. Plus join the discussion on twitter using the #CubeletsChat hashtag!